** Business Infographic Assignment 2018**Infographics are graphic representations of information, data or knowledge. They are great for presenting complex information quickly and clearly. The purpose of this assignment is to create infographics for your business. It should indicate what is **successful about your brand** and what **needs improvement**. **(You can make your own decisions regarding the latter sentence.)**A few things to consider when making your infographic:
1. Is there a key marketing image that is easily recognizable?
2. Key terms related to your company?
3. Tell the story of your brand using visuals, statistics, and key fun facts.
4. Profits from your company/Popularity of company
5. Marketing used by your company
6. Evidence vis your research- use it!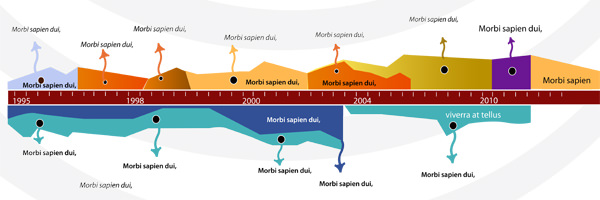Infographics will not just require typical data visualization techniques. There are other common graphics you can use like **badges, stickers, and buttons** to showcase smaller tidbits of information. Think about other alternatives like progress steps in a web form.The beauty of creating an infographic is that you can **bend the rules to include almost any element, as long as it fits well within the whole design.** Digital interfaces are fickle but easy to manipulate in the right context.Some of these features may be too complex or unnecessary for your projects. This is especially true if you are just beginning in the world of infographics, however, these interfaces might also **spark a creative idea which you can build** using any of these templates. Keep your thoughts open about other interface ideas because there are so many unique ways to present data.There are many sites that you can use for the visual component of this assignment so the hard part for you is deciding what the key points of the business that you need to highlight. **Optional Sites:**<https://infogr.am/><http://piktochart.com/><https://venngage.com/>
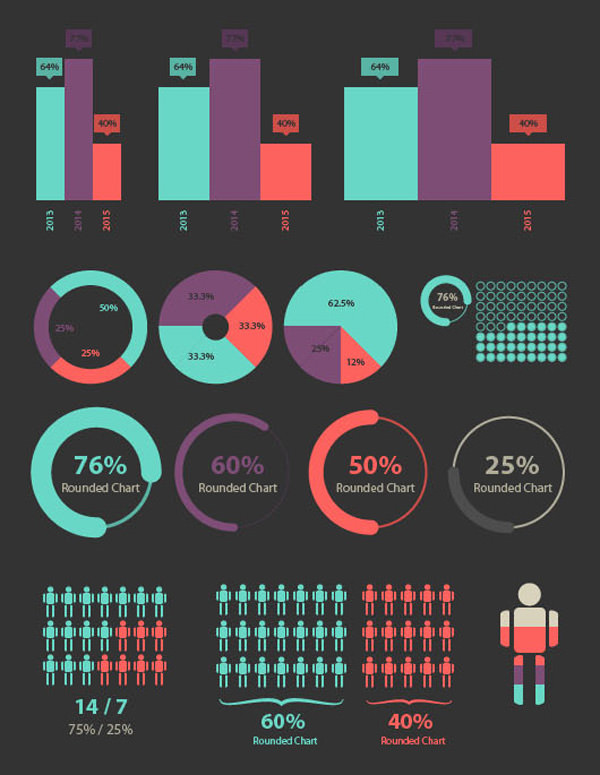
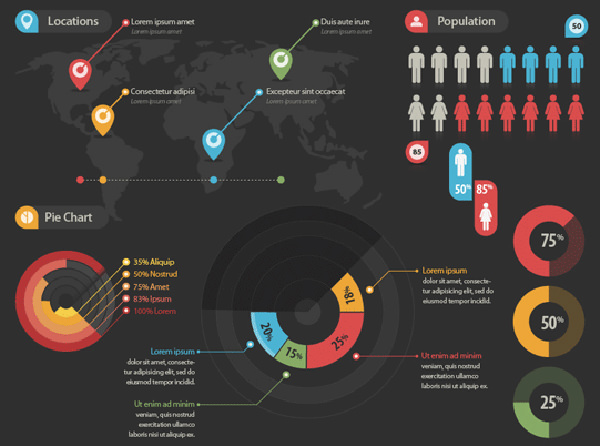
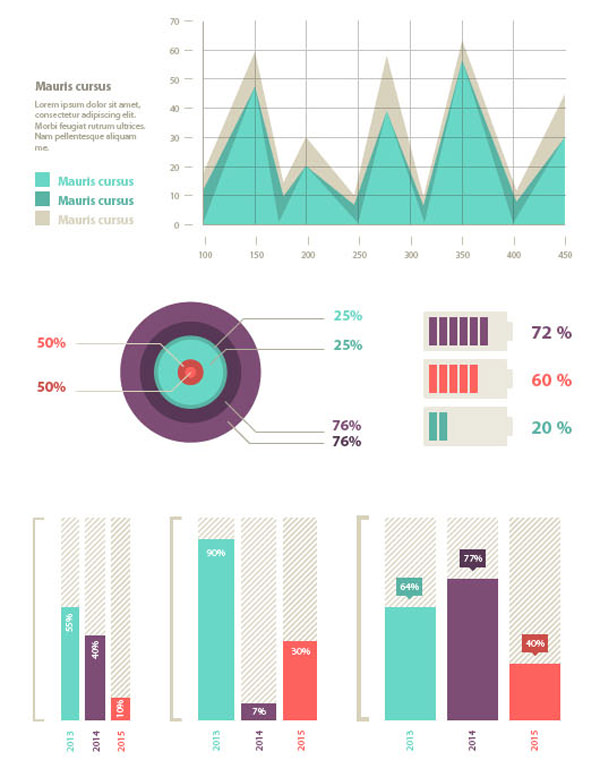
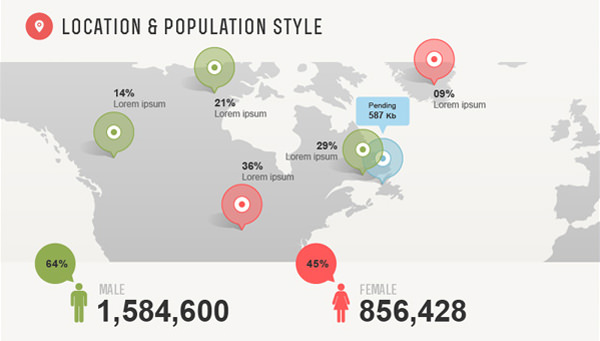
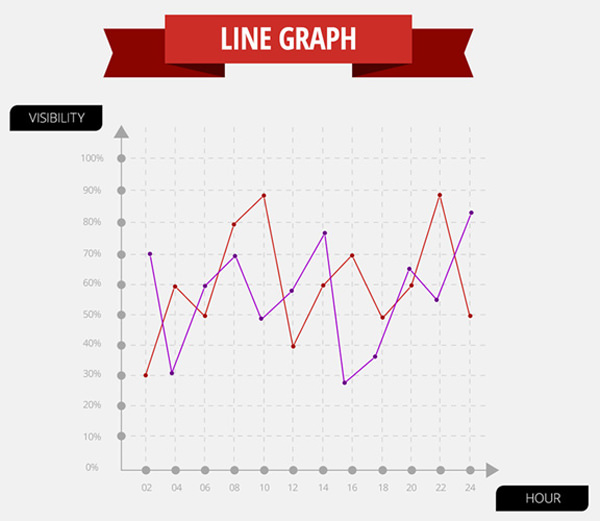
Here are some basic infographics to use for inspiration.
[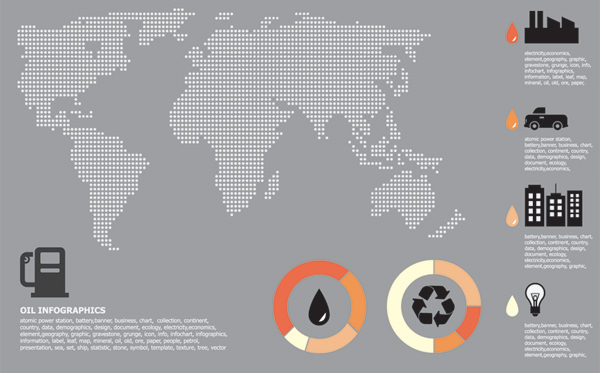](http://xooplate.com/template/details/11236-oil-theme-business-infographics-vector-chart)
[](http://xooplate.com/template/details/14459-huge-infographic-elements-vector-pack)
[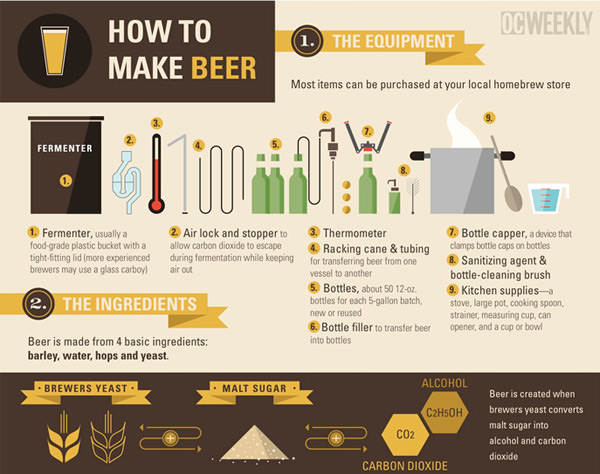](http://www.webbyarts.com/free-vector-downloads/how-to-make-beer-vector-infographics.html)
[](http://www.webdesignerdepot.com/2012/02/free-download-infographic-vector-kit/)
[](http://www.blugraphic.com/2013/04/08/100-infographic-elements-vector/)
[](http://www.pixeden.com/vector-objects/infographic-vector-elements-vol2)
[](http://freewebelements.com/free-infographics-template-to-download/)
## STUDENT EXAMPLES
[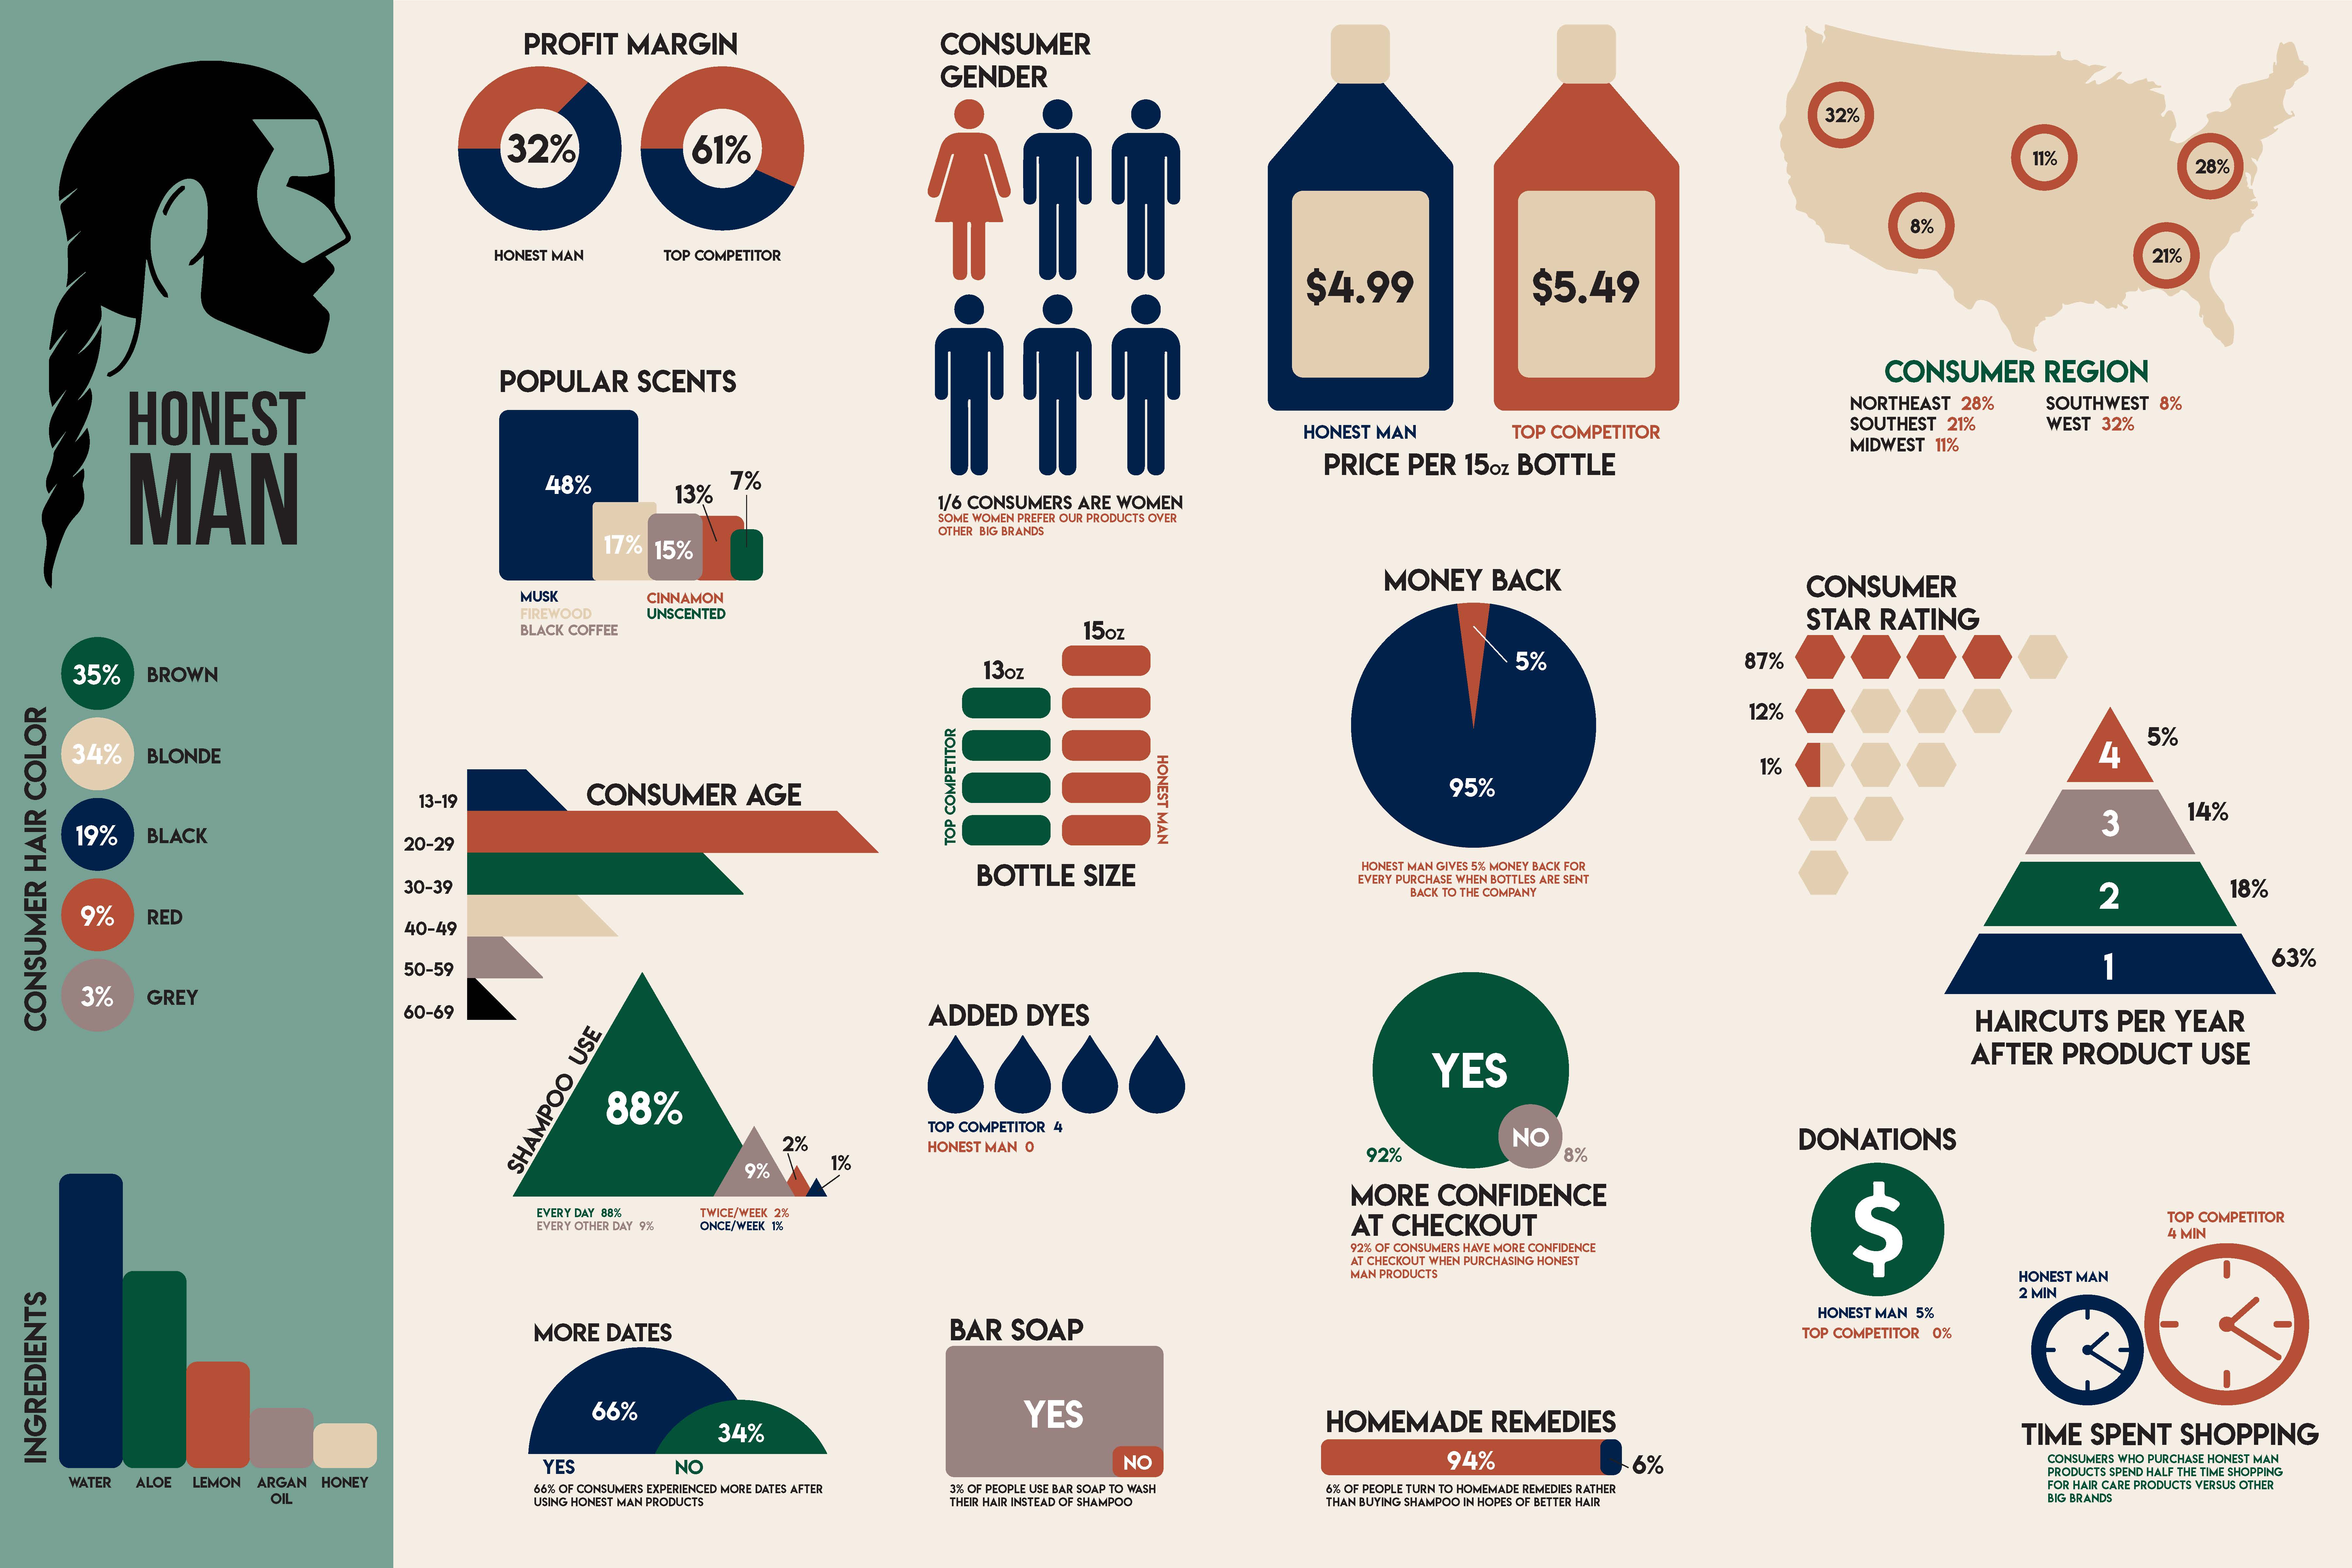](https://image-control-storage.s3.amazonaws.com/blog-images/2018/04/11082253/Binder1_Page_5.jpg)[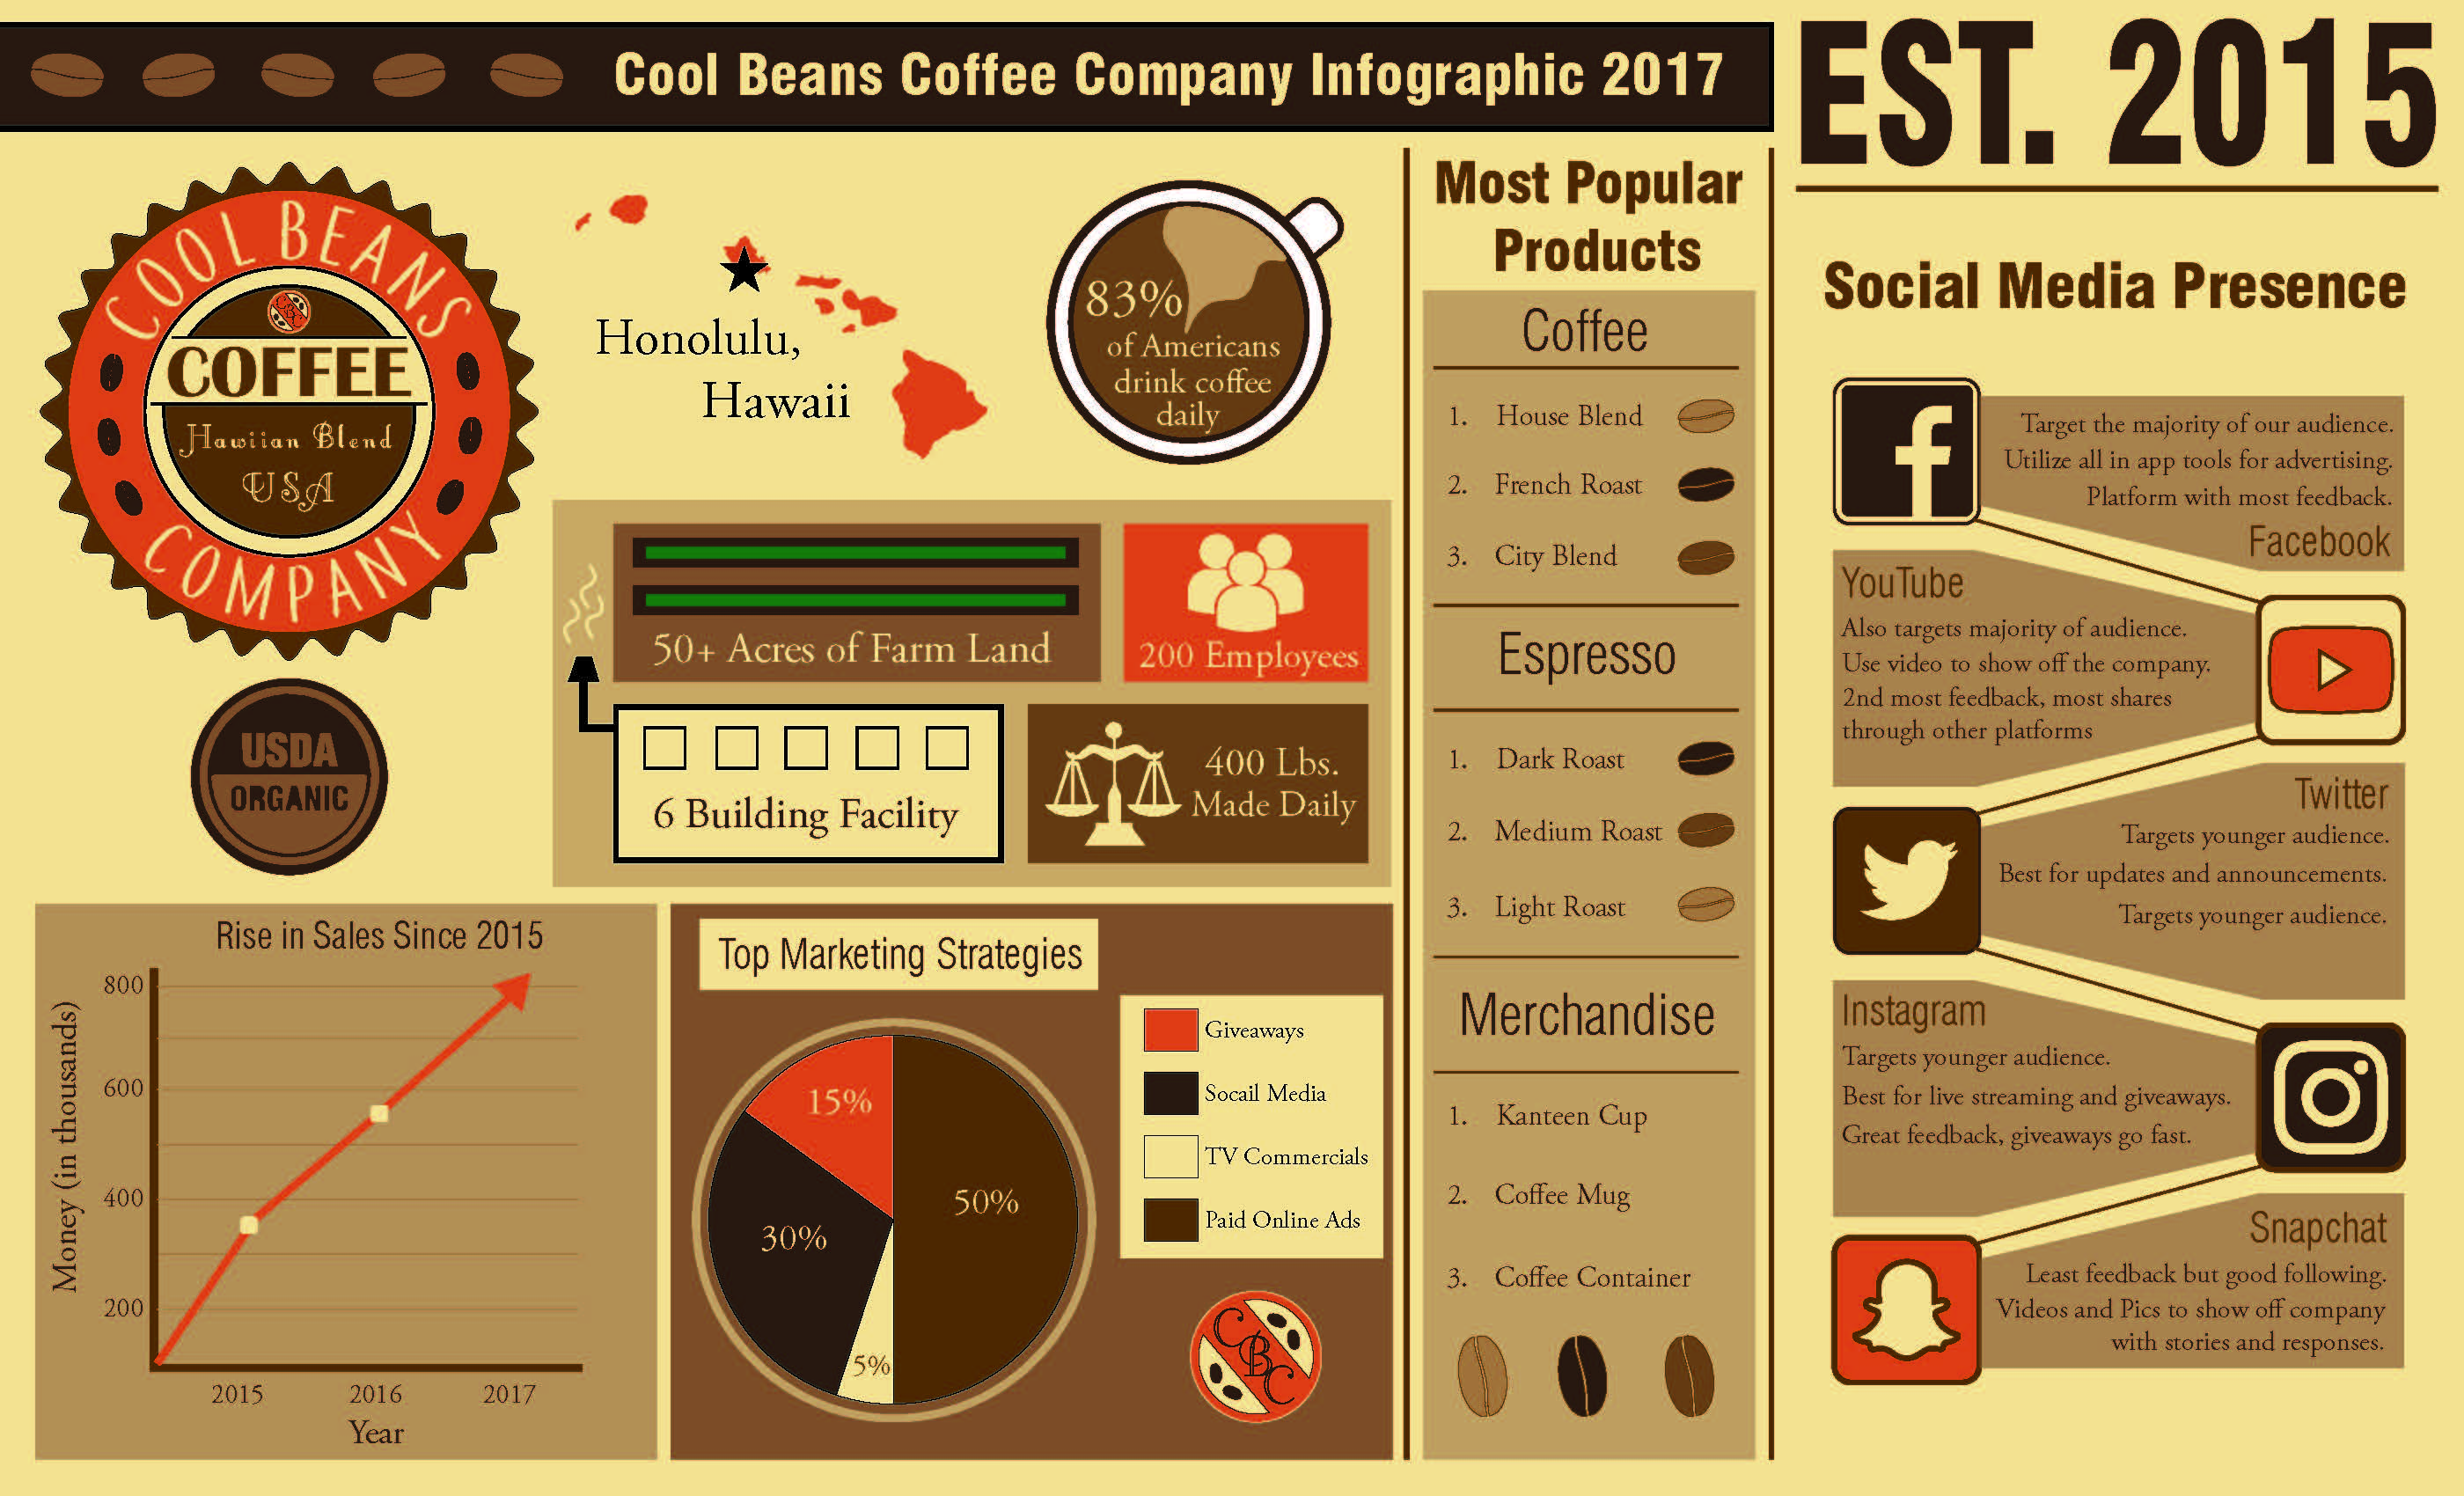](https://image-control-storage.s3.amazonaws.com/blog-images/2018/04/11082256/Binder1_Page_6.jpg)[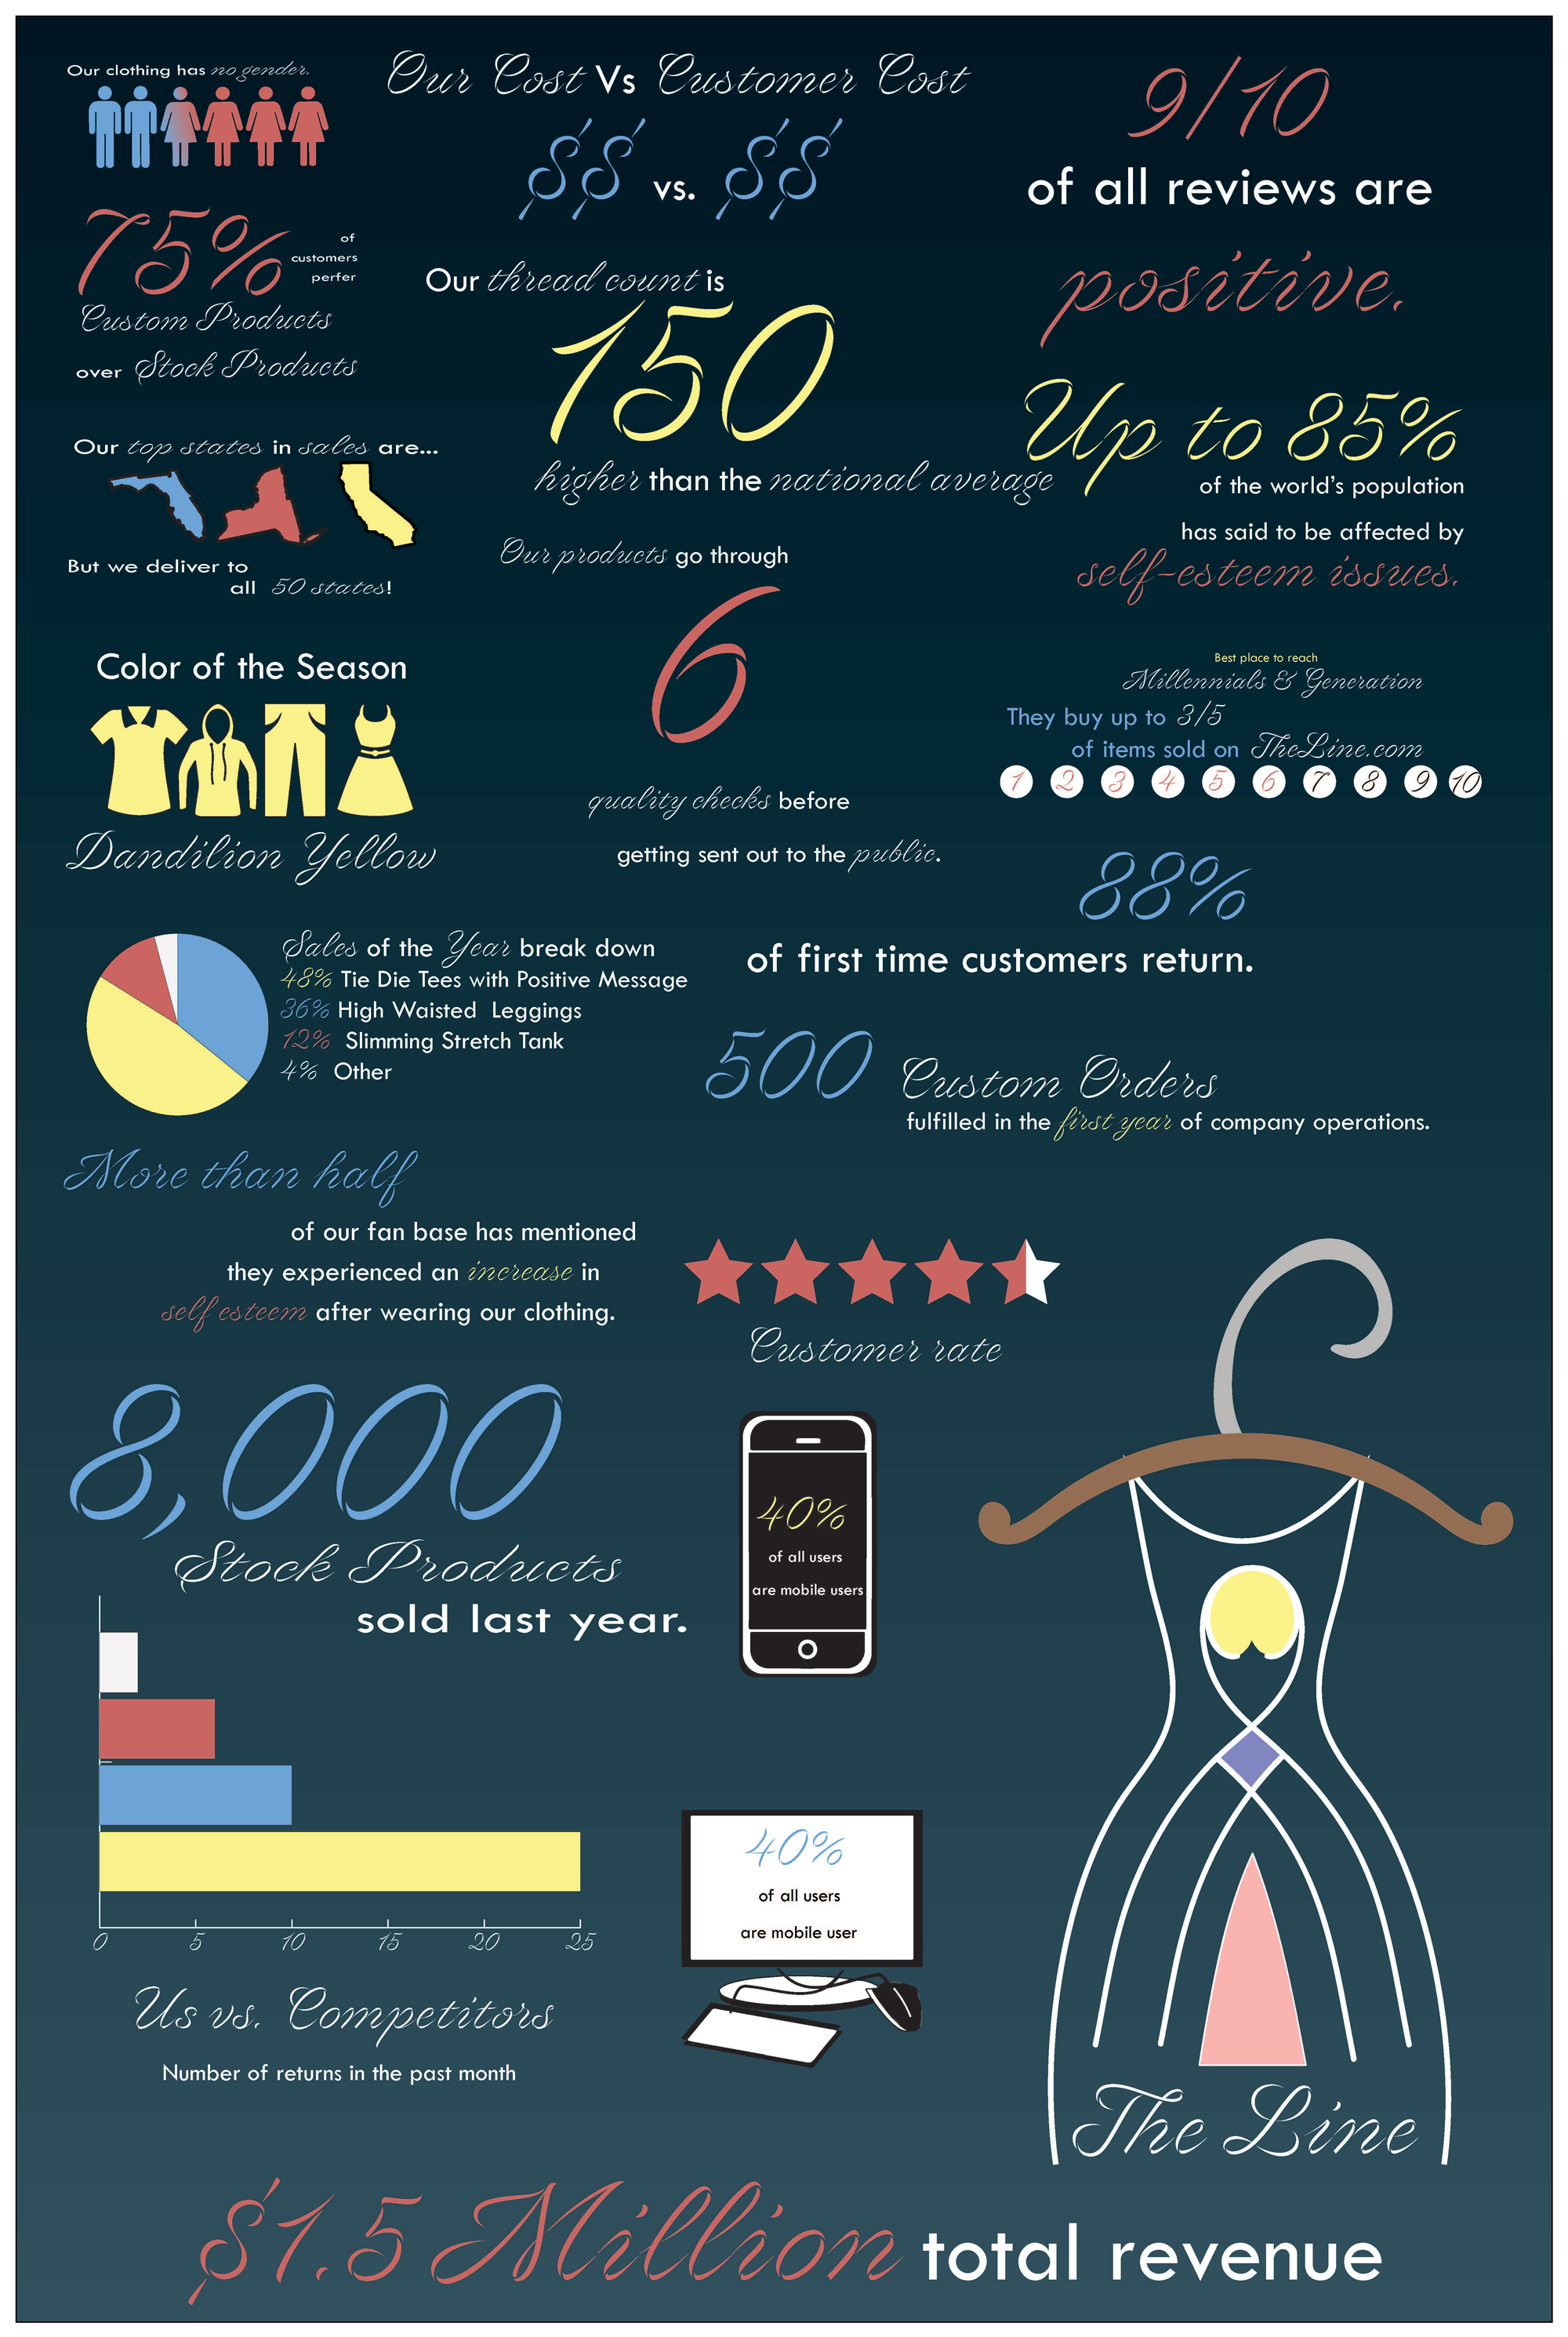](https://image-control-storage.s3.amazonaws.com/blog-images/2018/04/11082517/Binder1_Page_3.png)[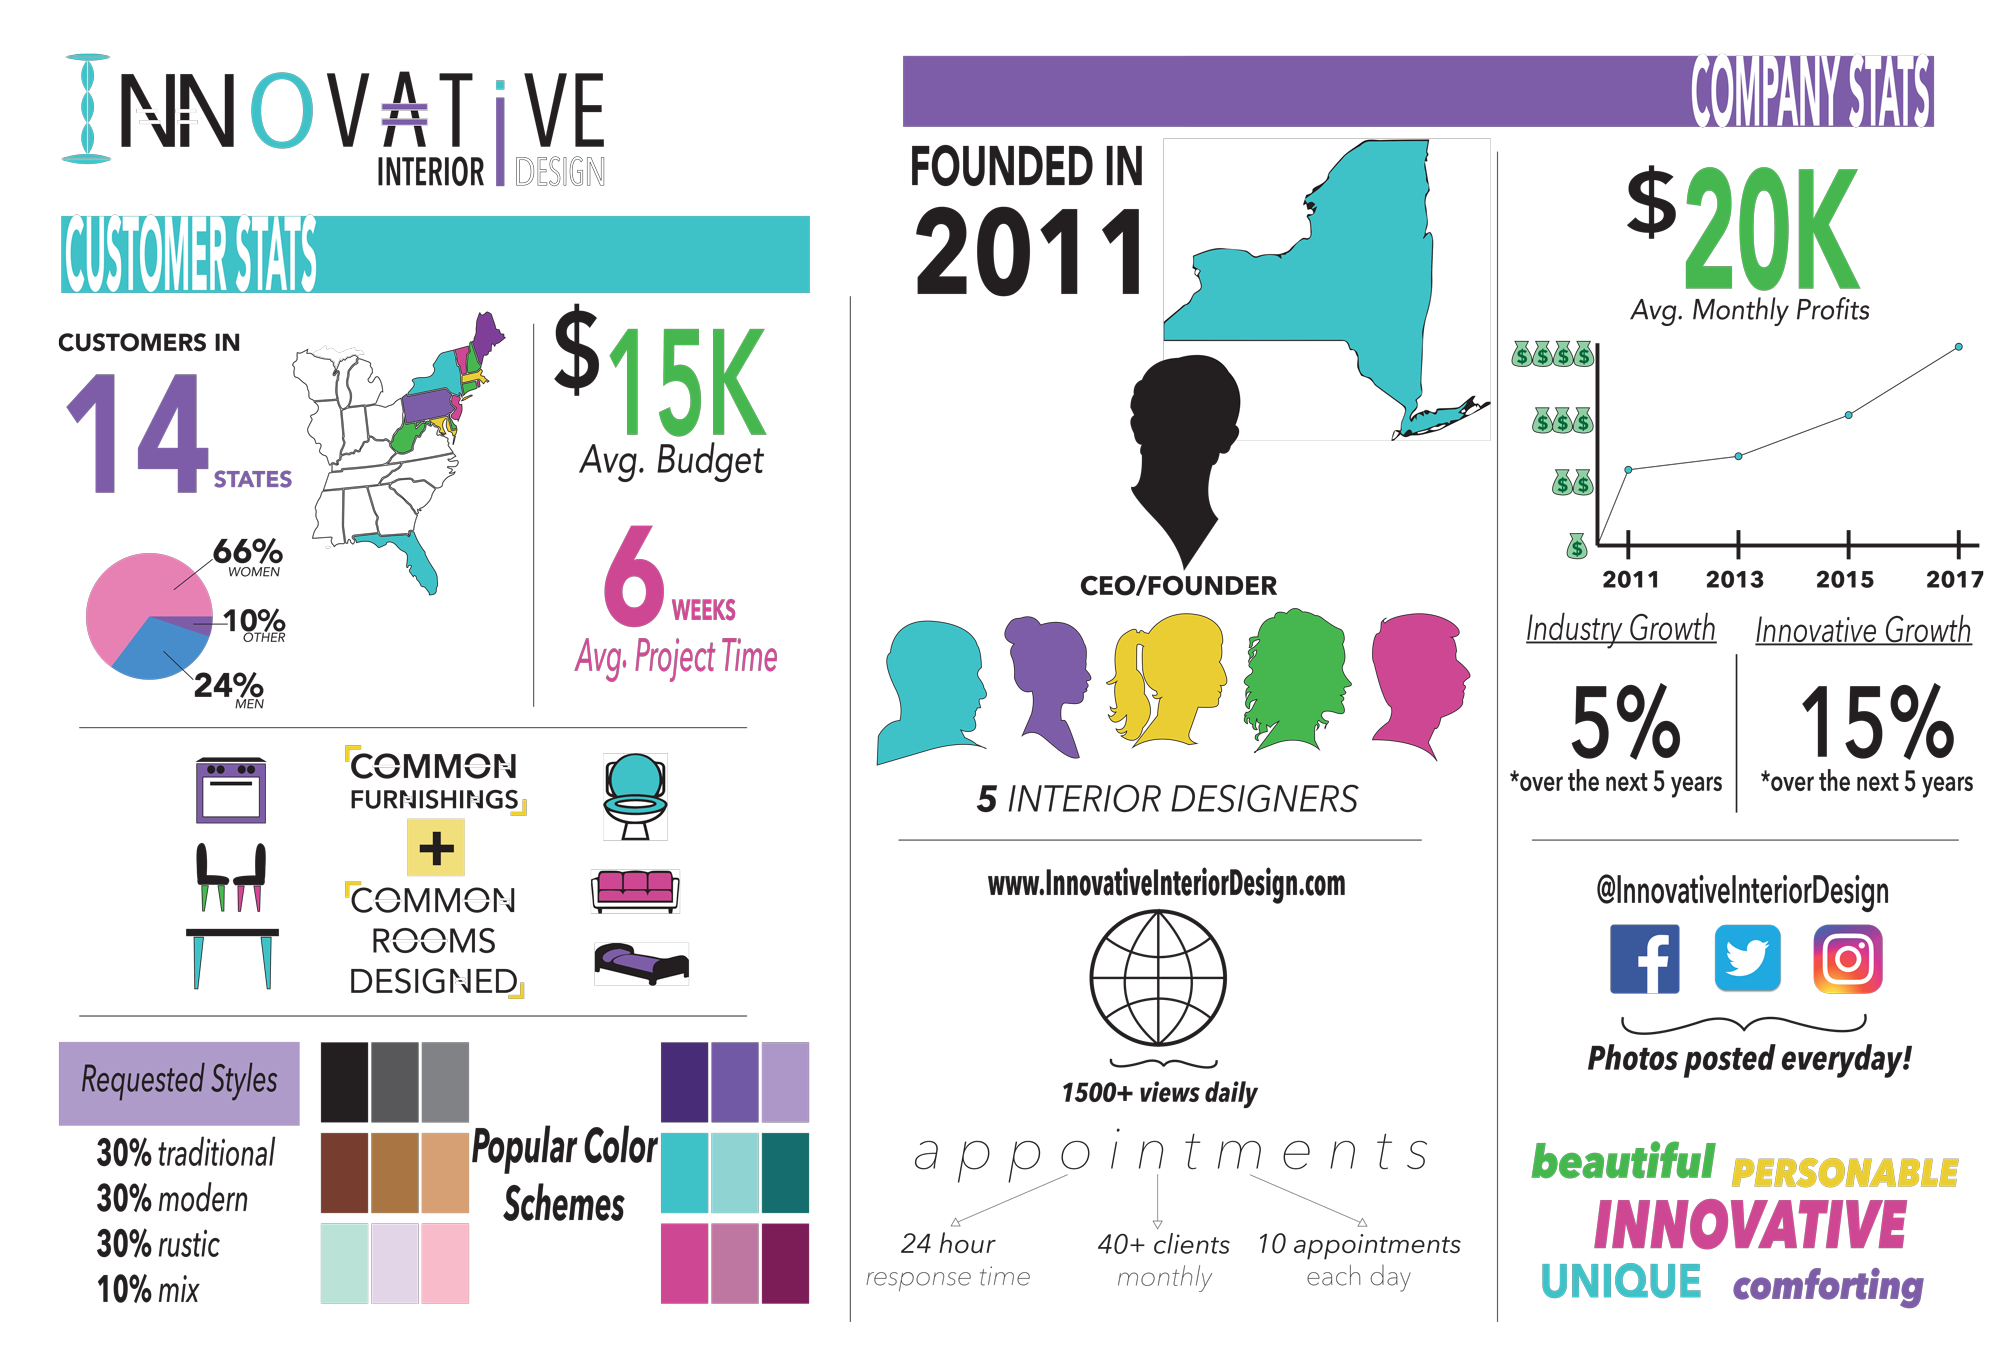](https://image-control-storage.s3.amazonaws.com/blog-images/2018/04/11083055/infographic-4.png)[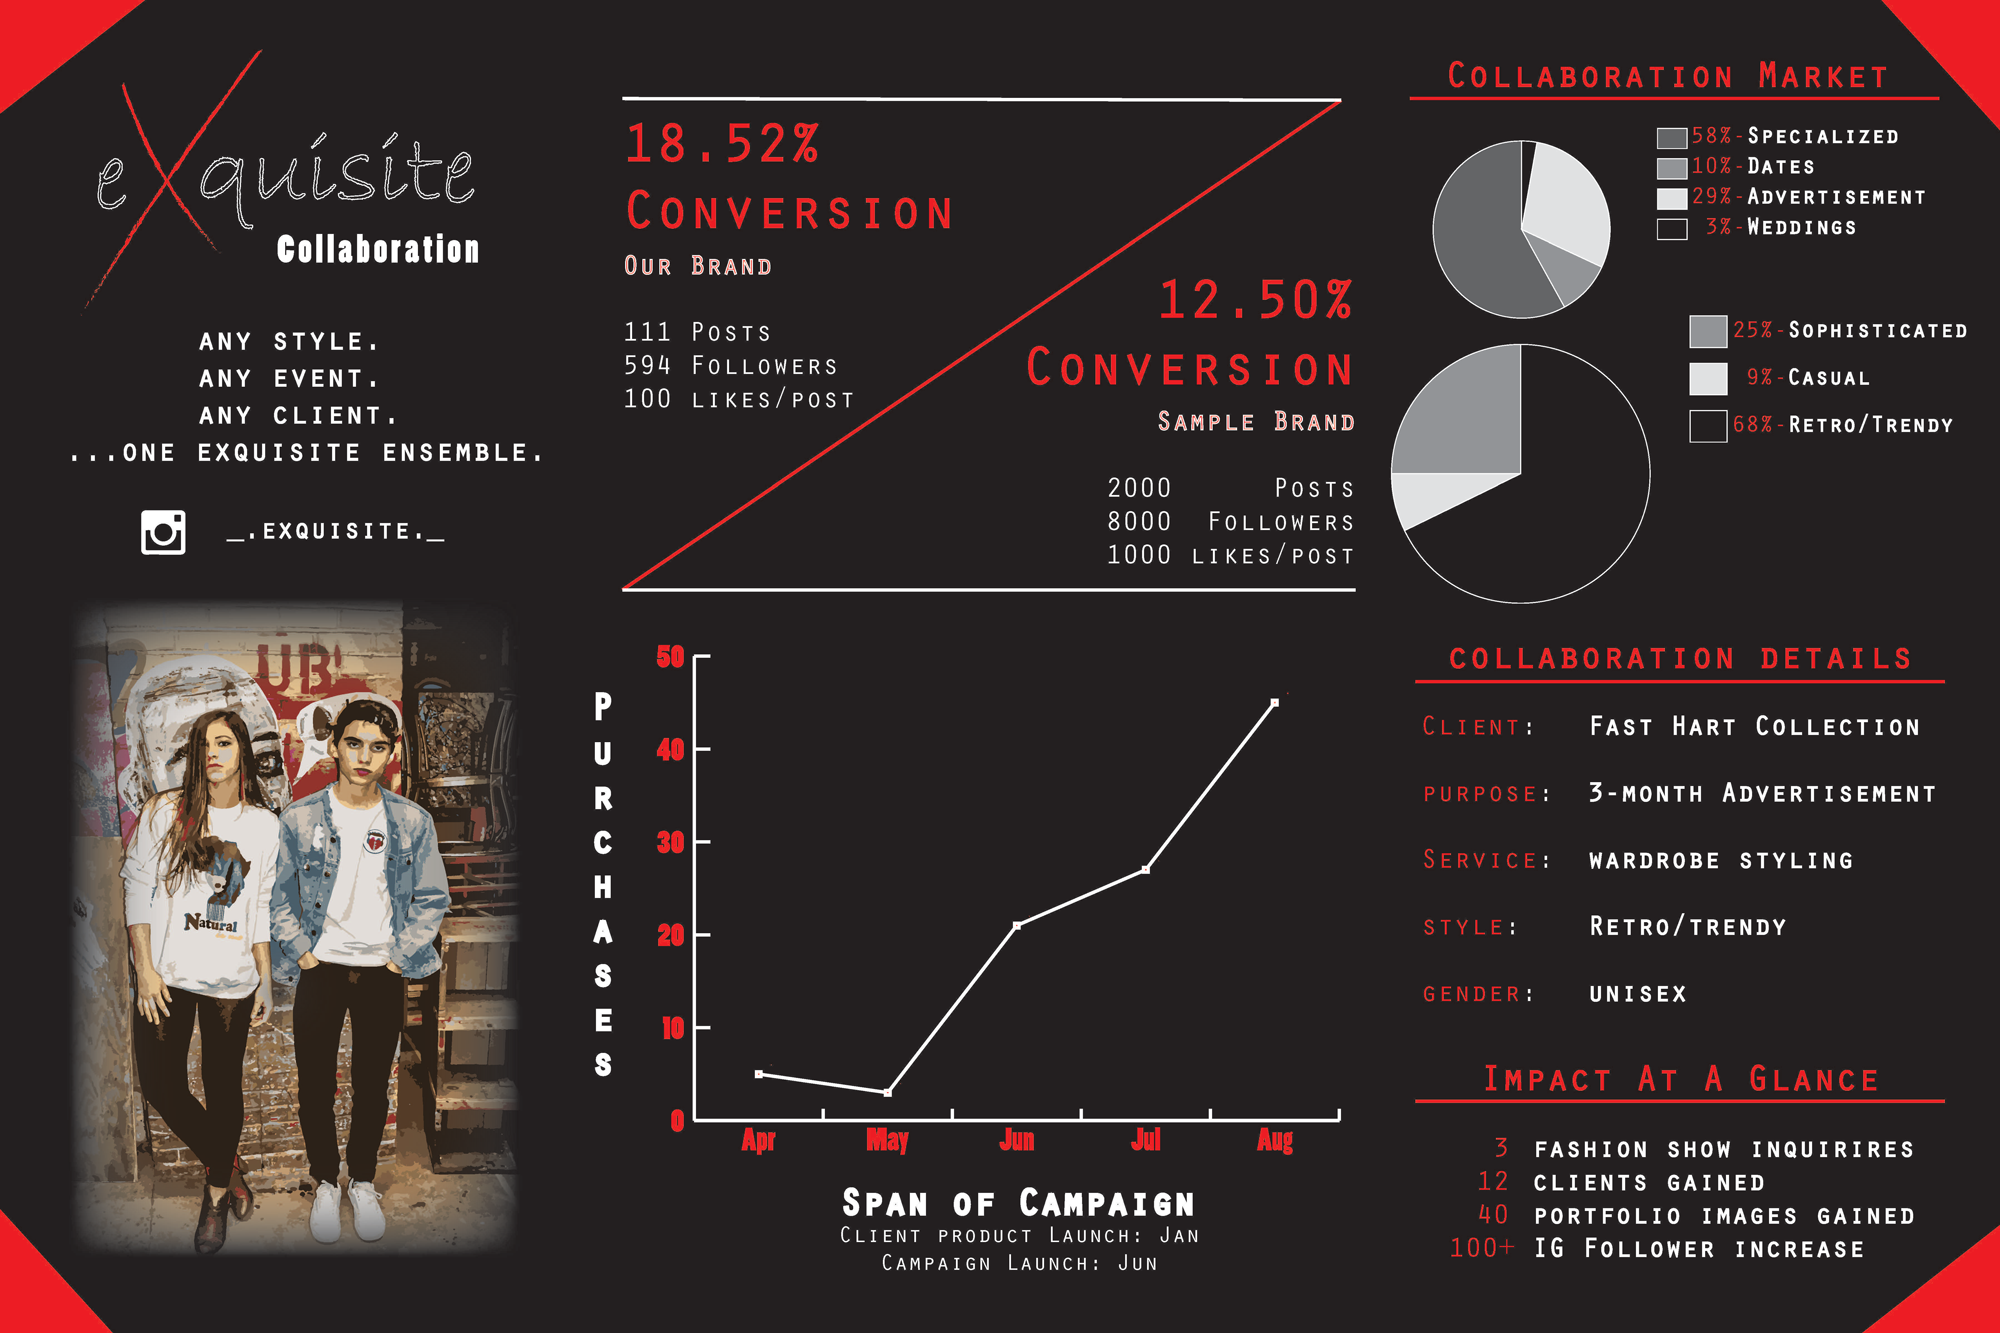](https://image-control-storage.s3.amazonaws.com/blog-images/2018/04/11083312/Binder12_Page_2.png)> [7 Essential Rules to Create Infographics](https://www.nuggetofjoy.com/7-essential-rules-to-create-infographics/)
https://www.nuggetofjoy.com/?p=17224&preview=true
Business Infographic Assignment 2020
Infographics are graphic representations of information, data or knowledge. They are great for presenting complex information quickly and clearly. The purpose of this assignment is to create infographics for your business. It should indicate what is successful about your brand and what needs improvement. (You can make your own decisions regarding the latter sentence.)
A few things to consider when making your infographic:
Is there a key marketing image that is easily recognizable?
Key terms related to your company?
Tell the story of your brand using visuals, statistics, and key fun facts.
Profits from your company/Popularity of company
Marketing used by your company
Evidence vis your research- use it!
Infographics will not just require typical data visualization techniques. There are other common graphics you can use like badges, stickers, and buttons to showcase smaller tidbits of information. Think about other alternatives like progress steps in a web form.
The beauty of creating an infographic is that you can bend the rules to include almost any element, as long as it fits well within the whole design. Digital interfaces are fickle but easy to manipulate in the right context.
Some of these features may be too complex or unnecessary for your projects. This is especially true if you are just beginning in the world of infographics, however, these interfaces might also spark a creative idea which you can build using any of these templates. Keep your thoughts open about other interface ideas because there are so many unique ways to present data.
There are many sites that you can use for the visual component of this assignment so the hard part for you is deciding what the key points of the business that you need to highlight.